Compound interest calculator
Starting balance, monthly deposits, a rate, and time. The result splits what you put in from what compounding earned.
Why the curve bends
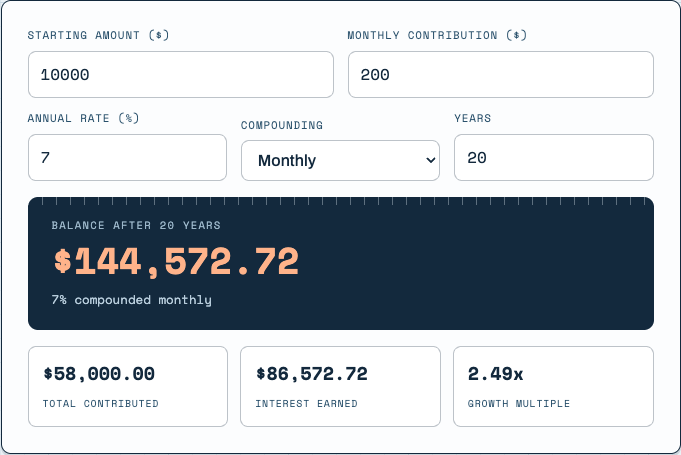
Run the default numbers above and look at the split: after 20 years, the interest earned exceeds everything you contributed. That crossover is the entire argument for starting early. The first decade of a compound-growth curve looks disappointingly flat; the growth lives in the years where interest is earning interest on itself.
Two rules of thumb worth knowing, both checkable with this calculator:
- The Rule of 72: money doubles in roughly 72 ÷ rate years. At 7%, about 10.3 years per doubling, which means a 40-year horizon holds four doublings: 16x.
- Contributions dominate early, returns dominate late. In year two, your deposit is most of the growth. In year twenty, the market's return on the pile is. This is why pausing contributions young costs more than it appears to.
One honest caveat: a fixed annual rate is a simplification. Real investment returns arrive lumpy (+20%, -12%, +8%), and the sequence matters when you are withdrawing. For accumulation-phase planning, the smooth-rate estimate here is the standard and reasonable tool.
Getting decisions, not just a big number, out of this tool
The balance is the headline, but the growth multiple in the corner is the number that makes scenarios comparable. A 2.49x multiple means every dollar you put in became two and a half; run a second scenario and the multiples can be compared directly even when the contribution amounts differ. When you are weighing "start now with $200 a month" against "start in five years with $350," compare the multiples and the interest-earned figures side by side and the earlier start usually wins on both, despite the smaller deposits.
Be careful which rate you type. Banks quote savings products as APY, which already includes compounding; if you enter an APY here, choose annual compounding, or you will double-count the effect. Investment return assumptions, by contrast, are nominal annual figures where monthly compounding is the sensible setting. The difference is small in any single year and real over twenty.
Also worth a deliberate look: the interest-earned figure is pre-tax. In a taxable account, a slice of that number belongs to the IRS every year, which quietly lowers your effective rate. The same inputs inside a Roth or 401(k) keep the whole figure, which is the entire case for using tax-advantaged space first.
The default inputs, checked by hand
Start with $10,000, add $200 a month, at 7% compounded monthly for 20 years. The starting sum grows by a factor of (1 + 0.07/12) raised to 240 months, about 4.039, becoming $40,387. The 240 contributions, each compounding from its own deposit date, accumulate to about $104,185. Together the balance reads $144,572.72 against $58,000 contributed, so $86,572.72 is interest and the multiple is 2.49x. Note where the money came from: the modest recurring deposit ends up responsible for more than twice what the lump sum produced, purely because there was more of it in total.
What the simulation actually does
Rather than plugging one closed formula, the calculator walks the account month by month: apply a month of growth, then add the contribution at month end, repeat for the full term. The monthly growth step is derived from your chosen compounding frequency by converting it to the equivalent monthly rate, so quarterly, annual, and daily settings all run through the same loop and remain exactly faithful to their frequency. You can verify the conversion is honest by switching the default scenario from monthly to daily compounding: the final balance rises only from $144,572 to $144,982, the frequency effect being real but small.
Simplifications to keep in mind
The model holds every input frozen for decades, which no real life does. Contributions stay flat, though most people raise them with their income, so a long horizon here tends to understate what a growing saver ends up with. Taxes, fund fees, and account fees are all absent, and a 1% annual fee behaves like reducing your rate by one point, an effect you can preview by just lowering the rate. Years are whole numbers between 1 and 80, and there is no inflation adjustment: the $144,572 in the example is future dollars, which will buy noticeably less than that figure suggests today. Treat outputs as a planning gauge, not a promise.
Frequently asked questions
How does compound interest differ from simple interest?
Simple interest pays only on the original amount. Compound interest pays on the balance including past interest, so growth accelerates: $10,000 at 7% simple earns $7,000 in 10 years, but compounded monthly it earns about $10,097.
How much does compounding frequency matter?
Less than people expect. $10,000 at 7% for 10 years grows to $19,672 compounded annually and $20,097 compounded monthly, about a 2% difference in the final balance. The rate and the years matter far more.
When are monthly contributions credited?
This calculator adds contributions at the end of each month, the standard "ordinary annuity" convention that matches most savings and retirement account behavior.
What rate should I assume for long-term investing?
Historically the US stock market has returned around 10% per year before inflation and about 7% after. Savings accounts track much lower. Whatever you enter, remember it is an assumption, not a guarantee.